582

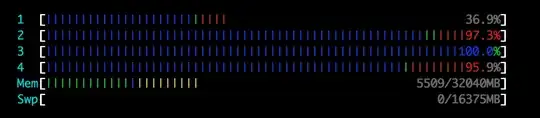
By default, htop shows colored status bars for processors, memory, and swap. From left to right, the bars are colored green, blue, yellow, and red depending on some thresholds.

What does it mean when the Memory bar has a small level of green and blue, and almost all the remainder is yellow? The swap bar is empty. The color settings for htop are "default".

htop screenshot

tobym
  • 6,271
  • 3
  • 17
  • 9

3 Answers3

676

Hitting F1 or h will show you the key. But for reference, the default colors are:

CPU:

  • Blue = Low priority threads
  • Green = Normal priority threads
  • Red = Kernel threads

Memory:

  • Green = Used memory
  • Blue = Buffers
  • Yellow/Orange = Cache

There are a couple of different color-schemes available, you can see them through hitting F2.

ash
  • 189
  • 1
  • 1
  • 8
sysadmin1138
  • 133,124
  • 18
  • 176
  • 300
  • 26
    What does orange mean in the CPU bars? Most of my CPU bars are filled with orange, but it doesn't say what it means in the key. – Etienne Perot May 13 '12 at 19:27
  • @EtiennePerot Perhaps your color setting is different from the default. https://bbs.archlinux.org/viewtopic.php?id=51818 Moreover htop itself has several color schemes (F2 -> Colors) – nodakai Oct 10 '12 at 00:40
  • 1
    @nodakai Maybe that's not the case... I see scarce orange bars in my CPU meters too, beisdes blue, green and red. – jjmontes Nov 15 '12 at 15:55
  • 2
    @EtiennePerot you are right. There are some more colors. See my answer ;). – jjmontes Nov 16 '12 at 09:26
  • 1
    Is it good that a lot of RAM is used by OS caches? Does that make everything faster? The numbers say `1859/8192MB`, I guess that excludes the OS cache. Including OS cache the bar is about 4/5 full. Good/bad? – Rudie Apr 05 '13 at 14:47
  • 15
    Yes, it's a good thing. See http://www.linuxatemyram.com/ for a good understanding. – GodsMadClown May 10 '13 at 19:08
  • 3
    Your answer is not totally right about the red color. It's not kernel threads but time spent in kernel code by any priority user threads and time given to kernel threads which spend all their time in kernel code. – Manuel Selva Jul 02 '14 at 14:11
  • 1
    This answer doesn't include Orange for CPU - what does orange mean? (I'm not in detailed view, and using standard color scheme) – UpTheCreek Dec 08 '15 at 12:17
  • 1
    Yellow CPU bar isn't explained, but you can turn on `[x] Detailed CPU time (System/IO-Wait/Hard-IRQ/Soft-IRQ/Steal/Guest)`, and THEN hit . There will be more explanation of the CPU bar colors. – AnrDaemon Apr 21 '16 at 20:35
  • 7
    [For anyone wondering what's meant with *cache*](http://askubuntu.com/a/155771/132098) – Abdull Oct 21 '16 at 16:57
  • Does Kernel threads mean heavy IO? Because my experience is that if a large number of process are reading from a single file, it becomes all red. – zyxue Sep 18 '17 at 23:58
  • Why is the kernel CPU on the right? Wouldn't it make sense to put it on the left? – Aaron Franke Feb 05 '18 at 19:38
  • Another interesting obsevation is that the percentage numbers at the right-hand end of the bar are part of the bar and coloured accordingly. – starfry Jun 17 '19 at 12:00
213

I couldn't find this documented elsewhere. Looking into the code:

There are two modes for CPU metrics reporting: the default one, and a "detailed CPU time" which can be enabled from the Setup screen (Display Options / Detailed CPU time). All of them show the percentage of time spent in different processes:

Default mode

  • Blue: low priority processes (nice > 0)
  • Green: normal (user) processes
  • Red: kernel time (kernel, iowait, irqs...)
  • Orange: virt time (steal time + guest time)

Detailed mode

  • Blue: low priority threads (nice > 0)
  • Green: normal (user) processes
  • Red: system processes
  • Orange: IRQ time
  • Magenta: Soft IRQ time
  • Grey: IO Wait time
  • Cyan: Steal time
  • Cyan: Guest time

Memory meters are more straightforward:

  • Green: Used memory pages
  • Blue: Buffer pages
  • Orange: Cache pages
  • Grey: Free (unused)

Note: Info obtained from htop source code at https://github.com/hishamhm/htop/blob/master/CPUMeter.c .

Luc
  • 294
  • 3
  • 18
jjmontes
  • 3,387
  • 2
  • 19
  • 27
  • 45
    press `F1` for help. – tgies Mar 20 '13 at 21:53
  • 9
    @tgies - the help page contains something different to this. – UpTheCreek Dec 08 '15 at 12:15
  • 4
    If you put the CPU bars into "detailed" mode _then_ press F1 and this info shows properly. – joshperry Aug 10 '16 at 18:58
  • 14
    If, like me, you see this orange CPU-bars on an Amazon EC instance (aug 2016), most likely your CPU is throttled because your so called "CPU credits" are spent. – berkes Aug 18 '16 at 08:11
  • Wait so in your answer under 'memory meters' orange is for cache pages, in sysadmin1138's answer under the same it says yellow/orange is for cache pages. Does the code mention anything about the yellow? – p̻̻̥r̥̻̥o̻j̤͛ec͔t̞dp Mar 26 '17 at 13:20
  • It DOES in fact show that info within progrm's help. That, combined with man, gives all the info you need. Having to look into a software code which is as famous and widespread as htop is really rare nowadays, it is normally caused by lack of search for documentation ;) – DGoiko Dec 20 '18 at 14:46
  • In htop-3.1.2 the Memory bar is showing a couple of *magenta* bars (between "buffers" and "cache"). According to F1 help, this is "shared" memory. I'm not sure if this is actually shared memory (between multiple processes) or just the amount of memory that is marked as shared (SHR) even if only one process has access to it. – davidA Feb 02 '22 at 23:29
8

There are several different colors for each of the bars, except the Swap bar. Here are the color keys used inside of htop:

enter image description here